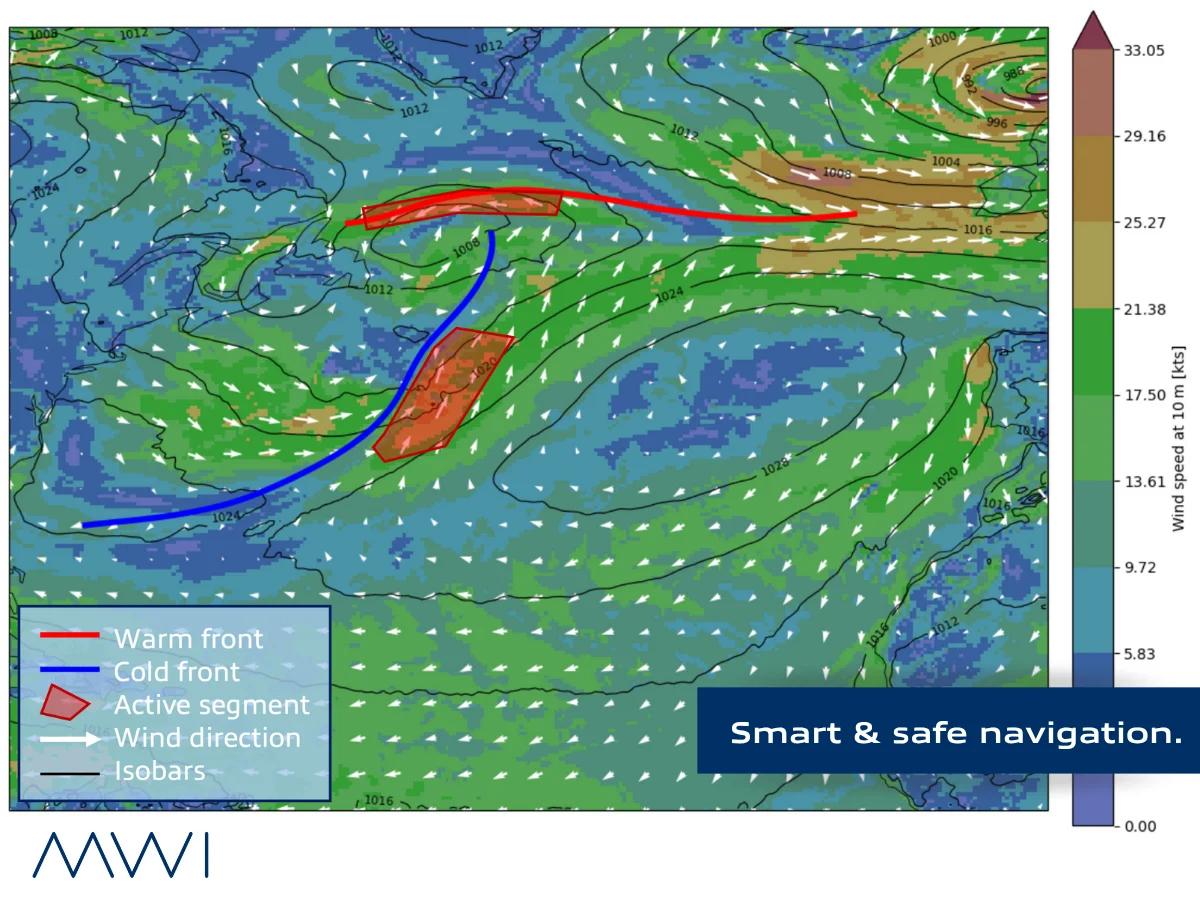
Marine Weather Intelligence has developed a methodology to detect and map weather fronts at sea, zones of sudden wind shifts, cross seas, and gusts that many maritime charts no longer represent. The approach was tested during the Vendée Globe 2024.
What are weather fronts?
Fronts represent boundaries separating air masses with different temperature, moisture, and pressure characteristics. These zones are particularly hazardous at sea, as they frequently produce:
- Sudden wind shifts
- Cross seas and confused swell patterns
- Strong gusts and squall lines
- Heavy rain and thunderstorms
For maritime operators, fronts are among the most demanding features to navigate safely, yet many maritime zones no longer have readily available weather front charts.
The challenge
While synoptic forecasts indicate the general position of pressure systems, the precise location and intensity of frontal zones, particularly their leading edges, is difficult to extract from standard NWP model output.
Marine Weather Intelligence concentrates on detecting and analysing these critical zones to support safer, more efficient navigation.
Our approach
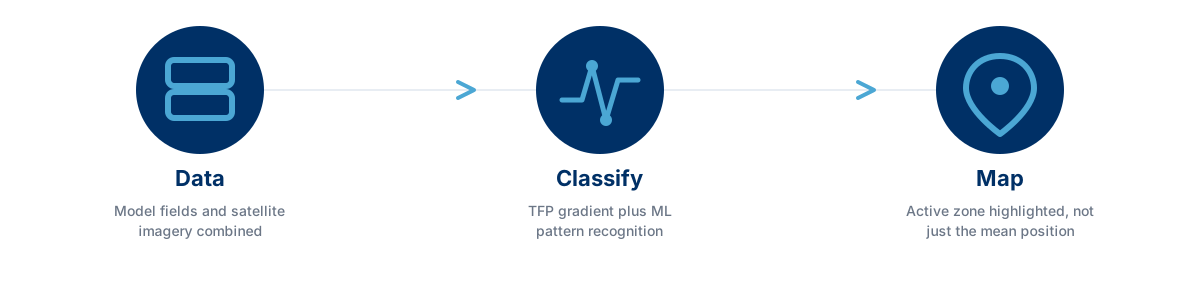
The company developed a methodology combining:
- Thermal Front Parameter (TFP): A field-derived metric that highlights the most active temperature gradient zones at the surface
- Machine learning capabilities: To identify and classify frontal structures from model fields and satellite data
This approach helps identify and visualise the most active and potentially hazardous sections of weather fronts, not just their mean position.
A front’s mean position, the single line typically drawn on a synoptic chart, doesn’t actually tell you much. The TFP field tracks where the temperature gradient is steepest along that line. The machine learning layer then sorts those readings: which stretches are genuinely active and hazardous, and which are weak and fading. The result isn’t a redrawn line, it’s a map showing exactly which part of the front deserves attention right now.
Why standard charts fall short
A synoptic chart’s frontal line is a useful summary, but it treats the whole front as equally hazardous, when in practice risk is rarely distributed evenly along its length. One stretch might carry a squall line and a sharp wind shift; a few hundred miles along the same nominal front, conditions can be comparatively benign.
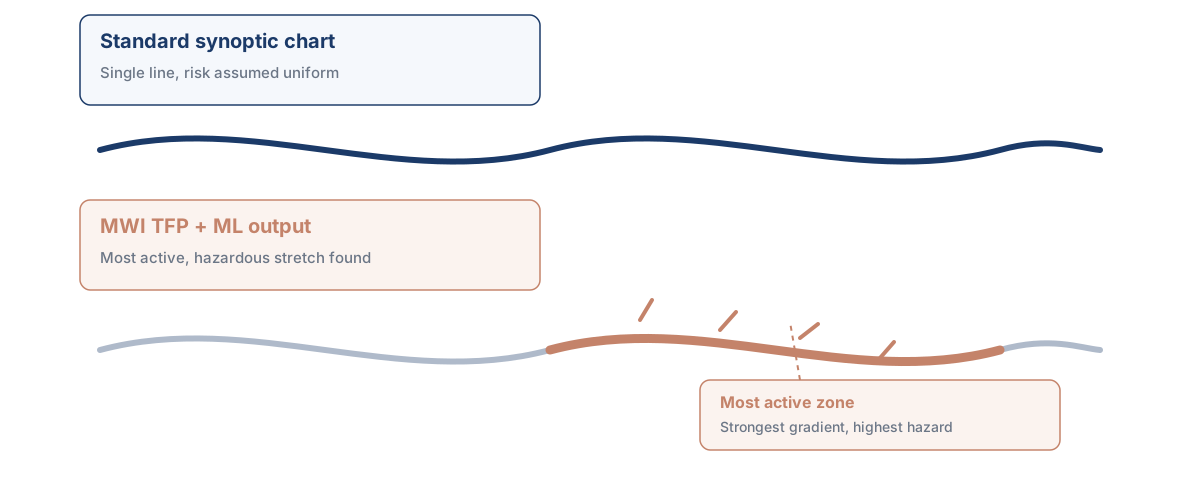
Crossing a front at its weakest point and crossing it at its most active point can mean the difference between a routine transition and a genuinely dangerous few hours. Without knowing which is which, a route plan can only assume the worst along the entire line, or gamble on the average.
Tested in real conditions
The methodology underwent testing during the 2024 Vendée Globe, demonstrating promising results in real-world conditions across the Atlantic and Southern Ocean.
The race provided an exceptional validation environment: extreme weather, continuous monitoring, and the highest standards of safety scrutiny in offshore sailing.
Conclusion
A weather front is not a single hazard uniformly spread along a line, it’s a gradient, with some stretches far more dangerous than others. Combining a Thermal Front Parameter field with machine learning classification lets Marine Weather Intelligence identify exactly which section of a front deserves real attention, rather than treating the whole line as equally risky.
Validated in the extreme conditions of the Vendée Globe 2024, this approach is built directly into Marine Weather Intelligence’s forecasting, giving every one of its business lines, from racing yachts to offshore installations, a clearer picture of where a front’s real risk lies.